Crew Readiness Belongs in the Operating Picture
In short
Fire departments plan from coverage maps, call volume and staffing data, but how the crews are doing rarely makes it onto the same picture. Readiness trends by station, shift and district, shown next to that operational data, let leaders adjust workloads and schedule recovery before problems show up as injuries, absenteeism, turnover or overtime.
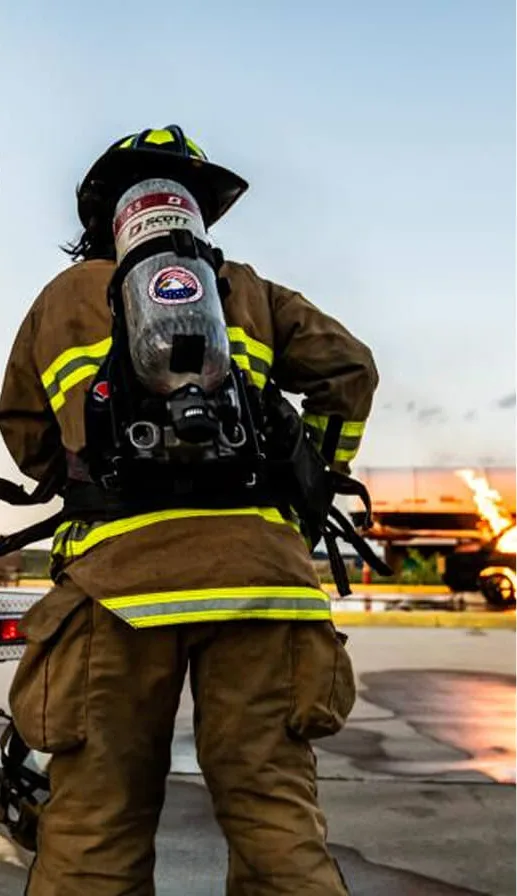
Crew readiness belongs on the same map as call volume and coverage, because decisions about people are still made after a problem shows up. Departments already see where operational pressure is building across a community. Adding how the crews are doing to that picture lets leaders act earlier: adjust workloads, rotate assignments and give crews time to recover before small issues compound.
What is missing from the fire service operating picture?
How the people staffing the resources are doing. Departments map drive-time gaps, call volume, deployment coverage and compliance, often in GIS tools such as Esri's ArcGIS. That visibility has changed how agencies plan and respond. Decisions about people have not caught up.
Most fire leaders do not lack concern for their crews. They lack visibility. By the time stress, fatigue or burnout is obvious, the department is already paying for it in injuries, absenteeism, turnover and overtime, and most departments are already stretched thin by rising call volume, staffing shortages and tight budgets.
Mike Cox, Director of Fire and EMS Solutions at Esri and a 27-year veteran of the Henrico County Fire Department, put it this way in an April 2026 article on Esri's blog:
"Departments have become exceptionally good at mapping operational risk. Yet decisions about people are still too often made after a problem surfaces, not before."
How would readiness show up next to operational data?
As trends across stations, shifts and districts, never as individual results. Placed next to call volume, incident demand, staffing and schedules, those trends let leaders ask questions such as:
- Is a station under more strain after a long run of incidents?
- Is fatigue building on a shift that covers more mutual aid calls?
- Are readiness trends changing as call volume rises in one district?
These are operational questions, the same kind fire leaders already answer with maps and dashboards every day.
What can a department do with that view?
Act before the cost shows up. The moves are ones chiefs already have:
| Signal in the trend | Possible response |
|---|---|
| A station dips after a run of major calls | Bring in peer support before it is requested |
| A shift trends down as mutual aid demand rises | Adjust workloads or rotate assignments |
| A district slides as call volume climbs | Plan recovery time and staffing ahead of the next surge |
Because leaders see aggregated data only, readiness becomes something a department can defend in a budget meeting, alongside response times and coverage. Cox closes his article on the same point:
"That's not a wellness conversation. It's an operational one."
Where does Okaya fit?
Okaya supplies the readiness data. It is a short, private check-in for adults. You talk with Sanora, Okaya's AI guide, for about 3 minutes, and it compares how you sound, what you say and how your expression moves today with your own earlier check-ins. It uses points from your face, not a video of you.
Individual results stay private to the individual. Leadership sees anonymized, aggregated unit-level readiness only. Okaya is part of the Esri Startup Program, so that aggregate can sit in ArcGIS next to a department's call and staffing data.
Key points
- Departments map operational risk well, but crew readiness is usually missing from the picture.
- People decisions still come after problems surface, at a cost in injuries, absenteeism, turnover and overtime.
- Readiness trends by station, shift and district can sit next to call volume, staffing and schedules.
- Leaders can then adjust workloads, rotate assignments and schedule recovery before problems compound.
Where should a department start?
Start with the map you already use. Pick the stations or shifts carrying the heaviest call load, add a short readiness check-in for those crews, and review the trend in the same meeting where you review response times and coverage.